How to Read the Performance & Uniform Valuation Chart
The Importance of Embedded Cash Flow Expectations
Embedded in every company’s stock price is the market’s forecast for the future performance of the firm. If the company beats that performance, the stock price goes up relative to the broader market. If the company fails to meet that performance, the stock price falls.
The Performance and Valuation Prime Chart in one place helps explain the company’s corporate performance over the past 10 years, the value the market has ascribed to the company historically and currently, while also explaining how the company has performed relative to the market.
This is an ideal starting point for the understanding of a company’s operational and market context.
Reported financial statements are a mess and earnings can go up and down because of hundreds of “non-cash” items that can make it extremely difficult for any investor to figure out. Thankfully, cash is still king. In the long run, the stock market prices company stocks based on the cash flow generating ability of the firm, not the accounting-distorted earnings.
For a long-term fundamental investor, understanding the embedded cash flow expectations in the stock price is key. The reported earnings may or may not even be relevant. As we see so often, there are companies with negative earnings that are priced with enormous valuations, and companies with solid earnings that are priced so cheaply. The problem is the inconsistency in the earnings.
Performance and Valuation Prime Charts were built to provide three cash-based assessments of the market’s valuation. These are based on cleaned-up, scrubbed, cash-based Uniform V/E multiples, Uniform V/A multiples, and DCF or Discounted Cash Flow models. An investor can better judge a stock as “expensive” or “cheap” when the accounting distortions have been removed and valuations have been triangulated across these three models. (These calculations have been modified with comprehensive adjustments to remove accounting and computation distortions found in traditional calculations of these metrics).
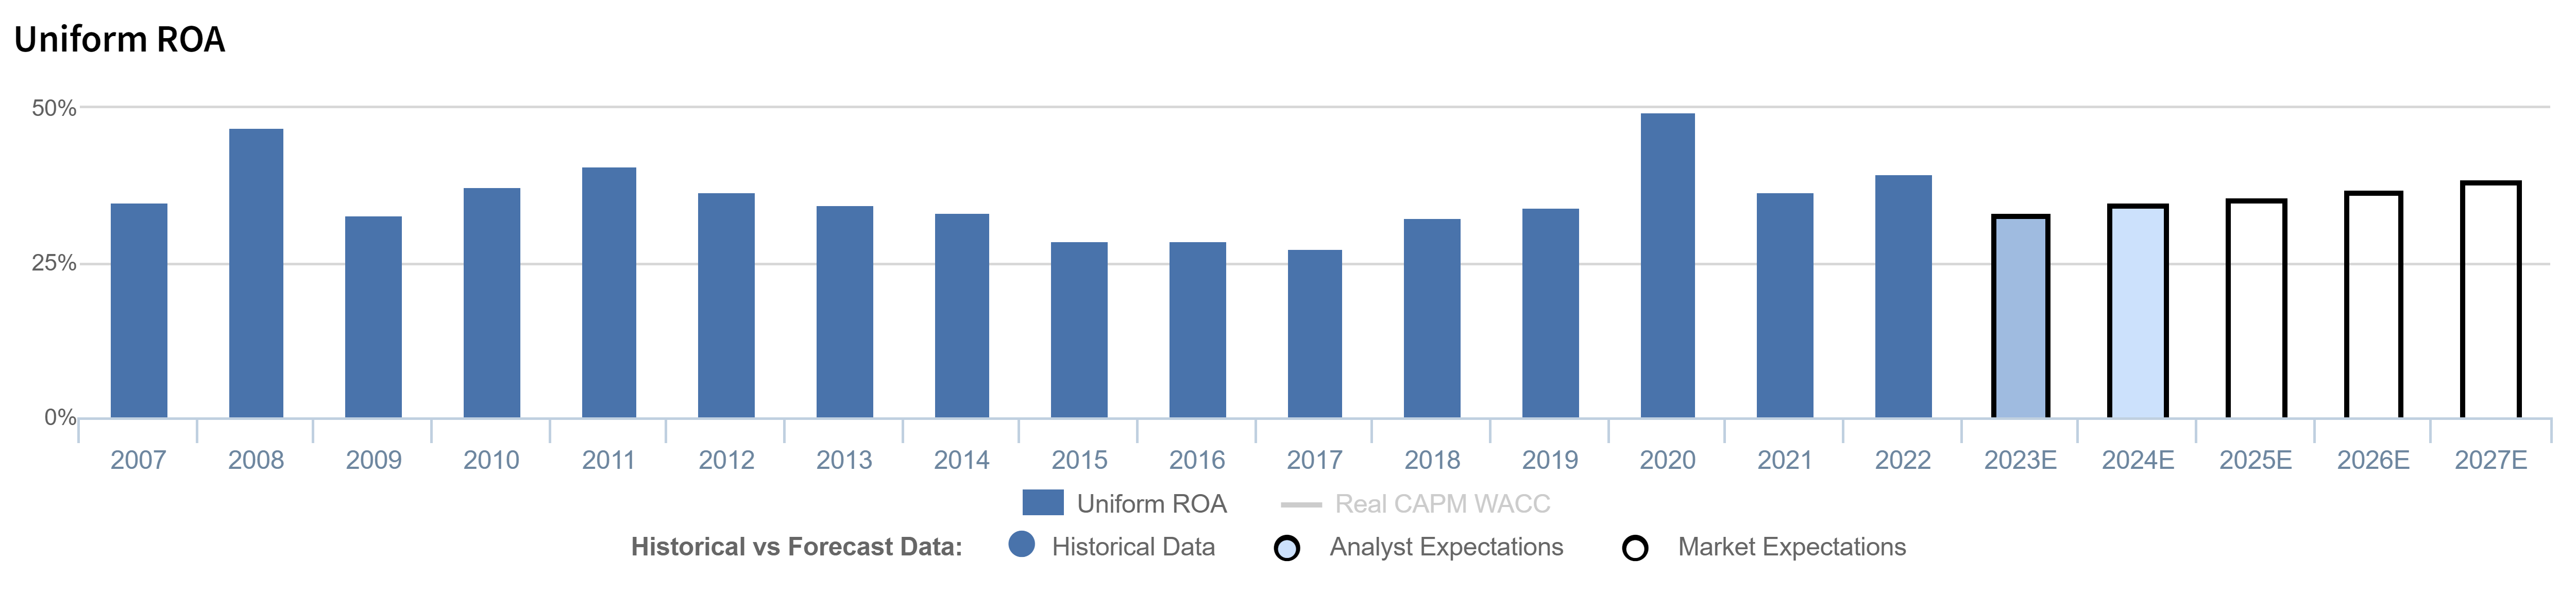
The Uniform ROA Panel Shows Historical and Forecasted Company Performance
Uniform ROA is the abbreviation for “Uniform Return On Assets.” Uniform ROA is a measurement that is calculated after the balance sheet, income statement, and statement of cash flows have been thoroughly adjusted to create an apples-to-apples set of financial information. An advanced ROA computation is then applied which corrects for many formulaic biases and flaws in traditional Return on Asset and Return on Capital Employed computations. Hence, the name “Uniform ROA”.
Uniform ROA explains the cash return that management generates on each dollar of cash it invests into the company. For this reason, the term Uniform ROA is used interchangeably with the term “cash flow return,” or simply, “returns” of the company or business. (For more, see the Institute’s publications, “When Cash Is Not Cash and Why” and “How to Calculate an ROA”)
The Uniform ROA panel of the Performance & Valuation Prime™ Chart demonstrates the firm’s annual cash flow returns over a decade of history. Two forecasted years are shown after the last full fiscal year (“LFY”), both marked with an 'E' to indicate that they are estimates. Calculations are based on publicly-available consensus analyst forecasts of firm sales, net income, capital expenditures, and other information. These are the Institute’s assessment of what consensus analyst estimates suggest for forecasted Uniform ROA.
Of utmost importance is the “Mkt” bar representing the Market-Implied Uniform ROA which is the last bar in the bar chart, and shows in white when viewing the chart in color. This Market-Implied Uniform ROA is determined by solving for the Uniform ROA that is the “embedded expectation” of the current trading stock price level. The Institute’s computation takes readily available public information and “backs into” the long-term Uniform ROA forecast implied by the stock price. This is incredibly valuable for assessing a company’s potential stock price upside/downside.
On the next page, we delve into various nuances of understanding Uniform ROA levels, relative to the company’s stage in the business life cycle, cost of capital, corporate averages, and forecasts.
Understanding Uniform ROA Levels and The Importance for Business Strategy Evaluation
Uniform ROA explains the cash return management generates on each dollar of cash it invests into the company. Uniform ROA is Uniform earnings divided by Uniform assets, with many adjustments to remove accounting distortions. The term Uniform ROA is used interchangeably with the term “cash flow return,” or simply, “returns” of the company. For more, see the Institute’s publications, “When Cash Is Not Cash and Why” and “How to Calculate an ROA.”
Uniform ROA is fundamental to understanding where a firm is in its life cycle, relative to its cost of capital, and knowing how that should impact the firm’s business strategy. Early stage companies tend to generate a Uniform ROA below their cost of capital, betting that future Uniform ROA will be far higher than the cost of capital. More mature firms can demonstrate higher Uniform ROA.
Companies that generate a Uniform ROA above the cost of capital are creating value above the required rate of return of their Uniform assets and should thus be grown so long as the incremental rate of return on new capital spending continues to be above the cost of capital. Companies that produce returns below the cost of capital are not producing sufficient returns on their Uniform assets. In those cases, that capital would be better used if re-allocated to businesses that can produce superior returns.
As a real Uniform ROA calculation, the comparable cost of capital for the business is generally around 5.0% to 6.5% for most companies, depending on the firm’s leverage, size, and a number of economic issues within the industry and markets in general. Note that this is lower than a traditional Weighted Average Cost of Capital taught in most schools of thought because most schools leave inflation in the cost of capital.
The final white bar explains the market’s “hurdle rate” of what is priced-in to the current valuation of the firm as of the date of the report production. When assessing the firm’s valuation level, the bar suggests the market’s level of performance expectations for the firm. Changing expectations for performance above that white bar’s level can generate significant increases in valuation and therefore, stock price. A low bar is a low hurdle. A high bar is a high hurdle, requiring higher performance to generate increased valuation levels.
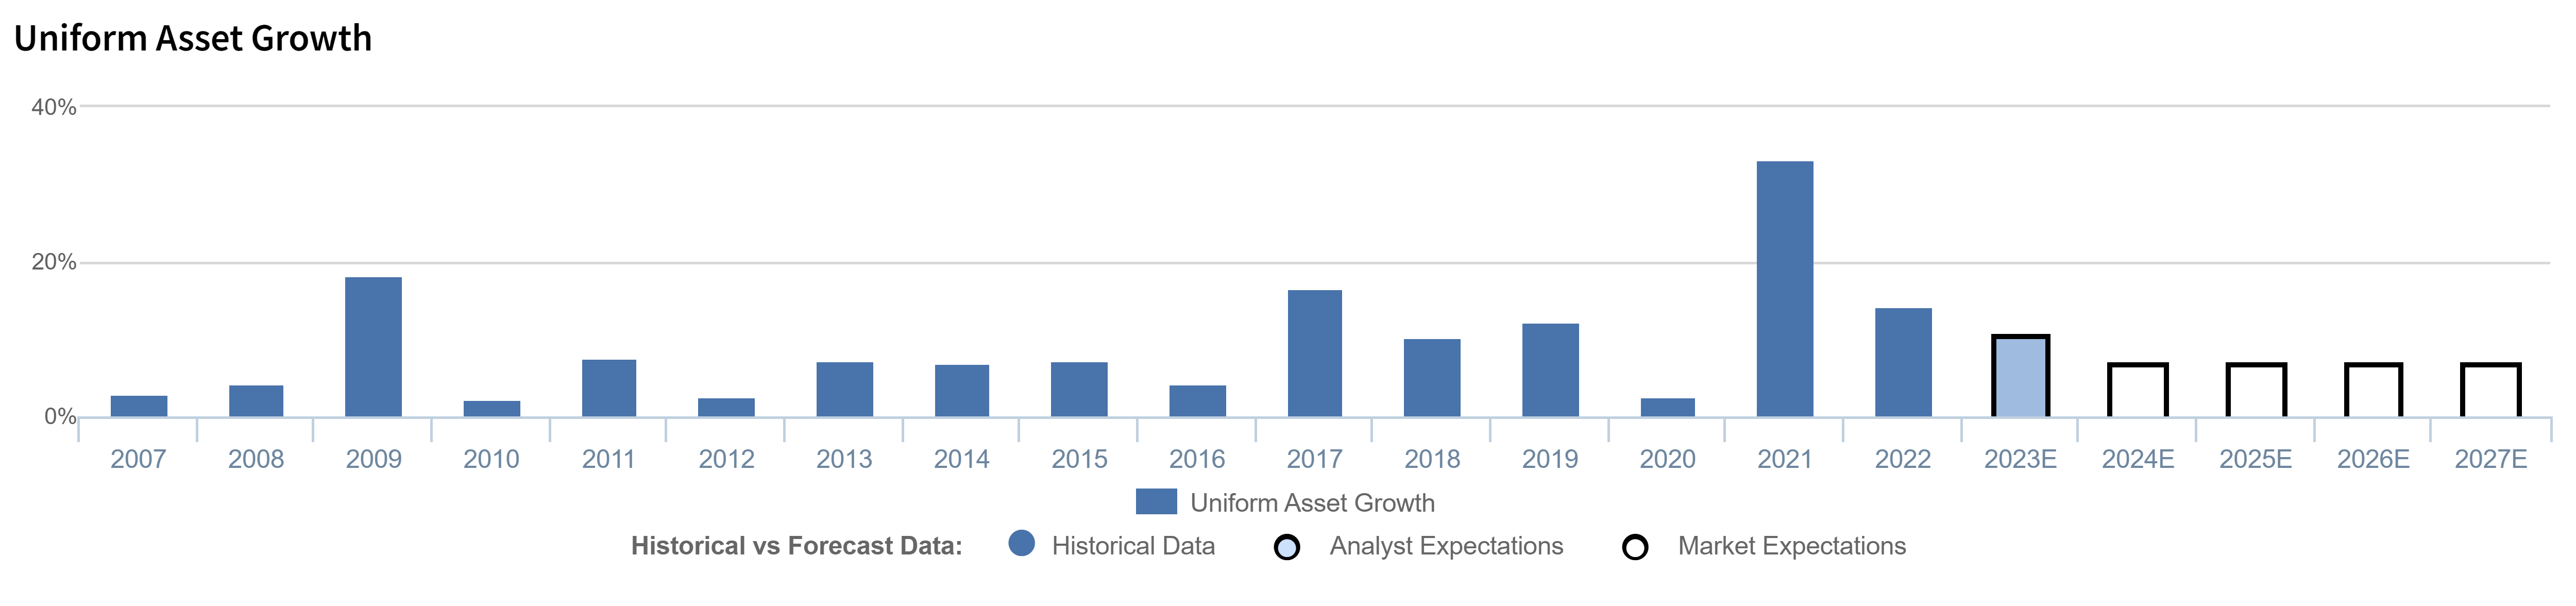
Uniform asset growth is the real annual growth rate of the cleaned-up and properly adjusted asset base of the company. This metric explains the management team’s propensity to reinvest over time. When viewed in the context of Uniform ROA, the growth rate explains a lot about management’s intended strategies and even performance incentives.
Uniform asset growth is a real metric, meaning it is adjusted for changes in currency levels, generally inflation. Uniform asset growth can come in the form of organic growth, where a firm simply purchases new assets through capital expenditures. Uniform asset growth can also come from acquisitions. Negative growth can come from divestitures, or simply assets aging, leaving the books, without replacement. If a firm shows capital expenditures that are just enough to replace assets that are aging, the chart should show a zero growth rate.
Companies that generate a Uniform ROA above the cost of capital are creating value above the required rate of return of their Uniform assets and should thus be grown. With the exception of start-up firms where longer-term forecasting horizons are common, companies that display growth when Uniform ROA is above the cost of capital generate increased value. If companies do this in excess of what the market expected, the market’s valuations and stock price will increase. Firms that grow when Uniform ROA is below the cost of capital will destroy economic value. If this is done in excess of the market’s forecast for value destruction, valuations and stock prices go lower. When firms grow at rates of return that match the cost of capital, no economic value is created. Valuations tend to stagnate.
The final white bar for Uniform asset growth in the second panel is a best guess calculation of the expected growth rate of the firm’s balance sheet, its Uniform asset growth rate. This estimate is based on a combination of management guidance, consensus analyst estimates of growth, and the particular management team and industry’s growth patterns. The market-implied Uniform ROA in the first panel is dependent on this growth estimate and can be adjusted if the growth estimate is believed to be too high or low for whatever reason.
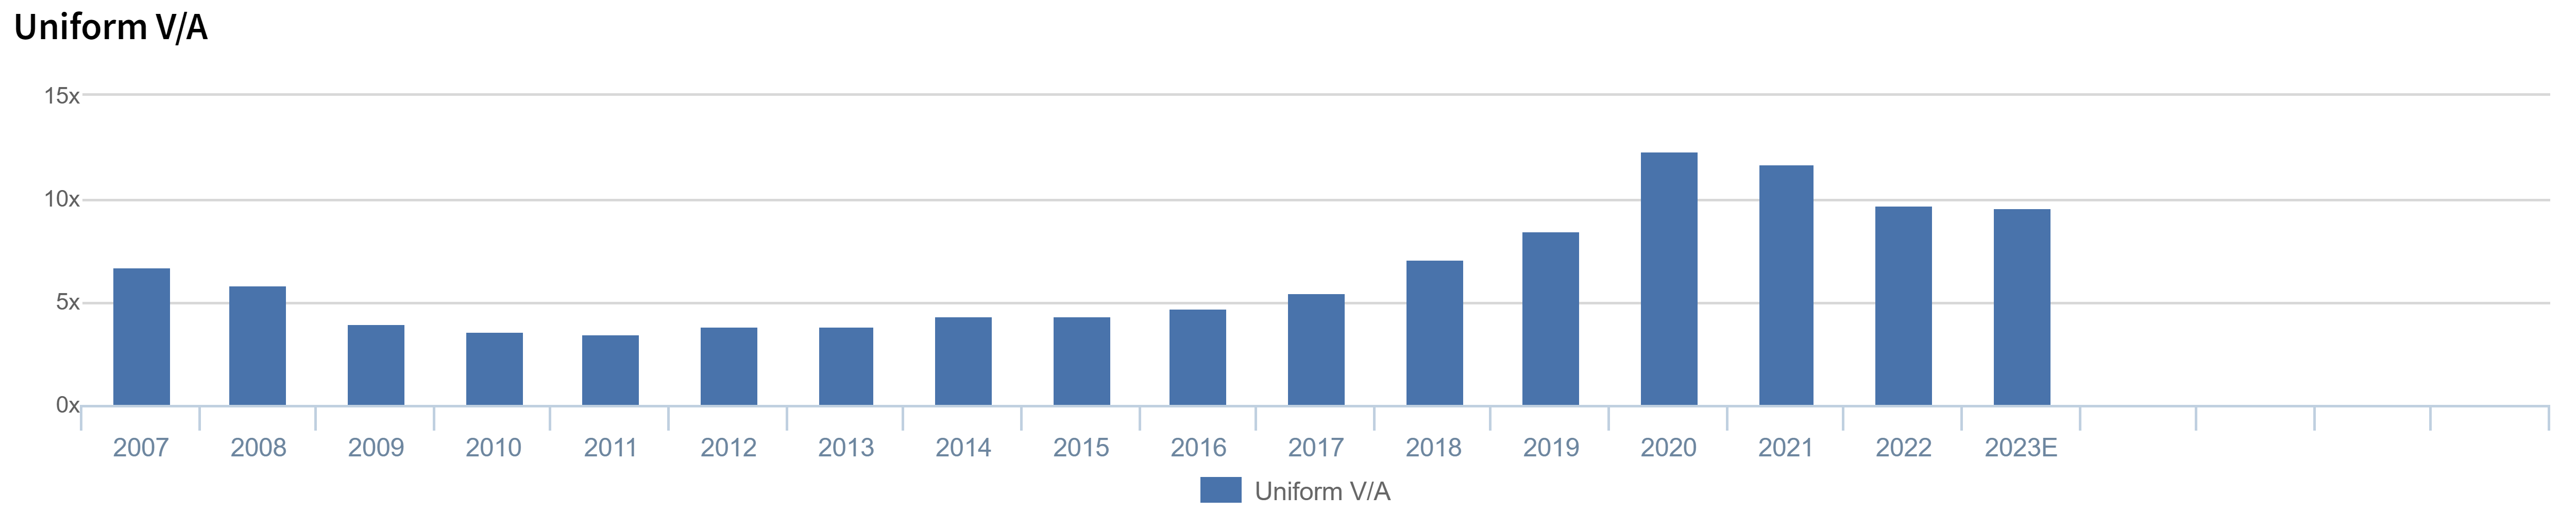
Uniform V/A is a calculation comparing the Uniform Enterprise Value (V) of the company to its Uniform assets. The “V” is the market capitalization of the company plus the total debt of the company, including off-balance sheet debt. The Uniform assets reflect the total assets of the firm, necessarily adjusted for problematic accounting standards for reporting of the balance sheet. Uniform V/A can be thought of as a very “cleaned-up” Price-to-Book metric. “Uniform assets” is the same as the denominator of the Uniform ROA calculation.
Throughout the 50+ years of history and across industries and countries, there continues to be a tremendously strong relationship between Uniform ROA levels and Uniform V/A. In other words, firms that generate higher cash flows relative to their investment base experience higher market valuations relative to their investment base.
The historically strong relationship between valuation levels and firm “quality” – between Uniform V/A and Uniform ROA – creates an opportunity for evaluating valuation levels very quickly. The empirical, observed relationship between quality and valuation when measured this way is amazingly intuitive and logical.
The market tends to value Uniform V/A at “1” when the firm generates a Uniform ROA at the cost of capital. In other words, firms trade near their “book value” when their returns are merely at their cost of capital. When the firm’s cash flow returns sustain double the cost of capital, the valuations tend to be double the book value, and so on. Again, the observation is extremely intuitive and even somewhat serves as a proof of the necessity for “cleaning-up” the accounting data. Relationships between traditional Price-to-Book metrics and other return metrics are seldom so logical.
Interestingly, there appears to be a “floor” for valuations, regardless of how negative returns can go. Uniform V/A tends to not fall substantially below 0.6 unless there is a risk of credit default or bankruptcy. When Uniform V/A is far above the traditional relationship to Uniform ROA, it does not necessarily suggest overvaluation. It suggests that investors’ forecasts for future Uniform ROA improvement and growth could be far higher than traditional firms, such as in earlier growth stages of companies.
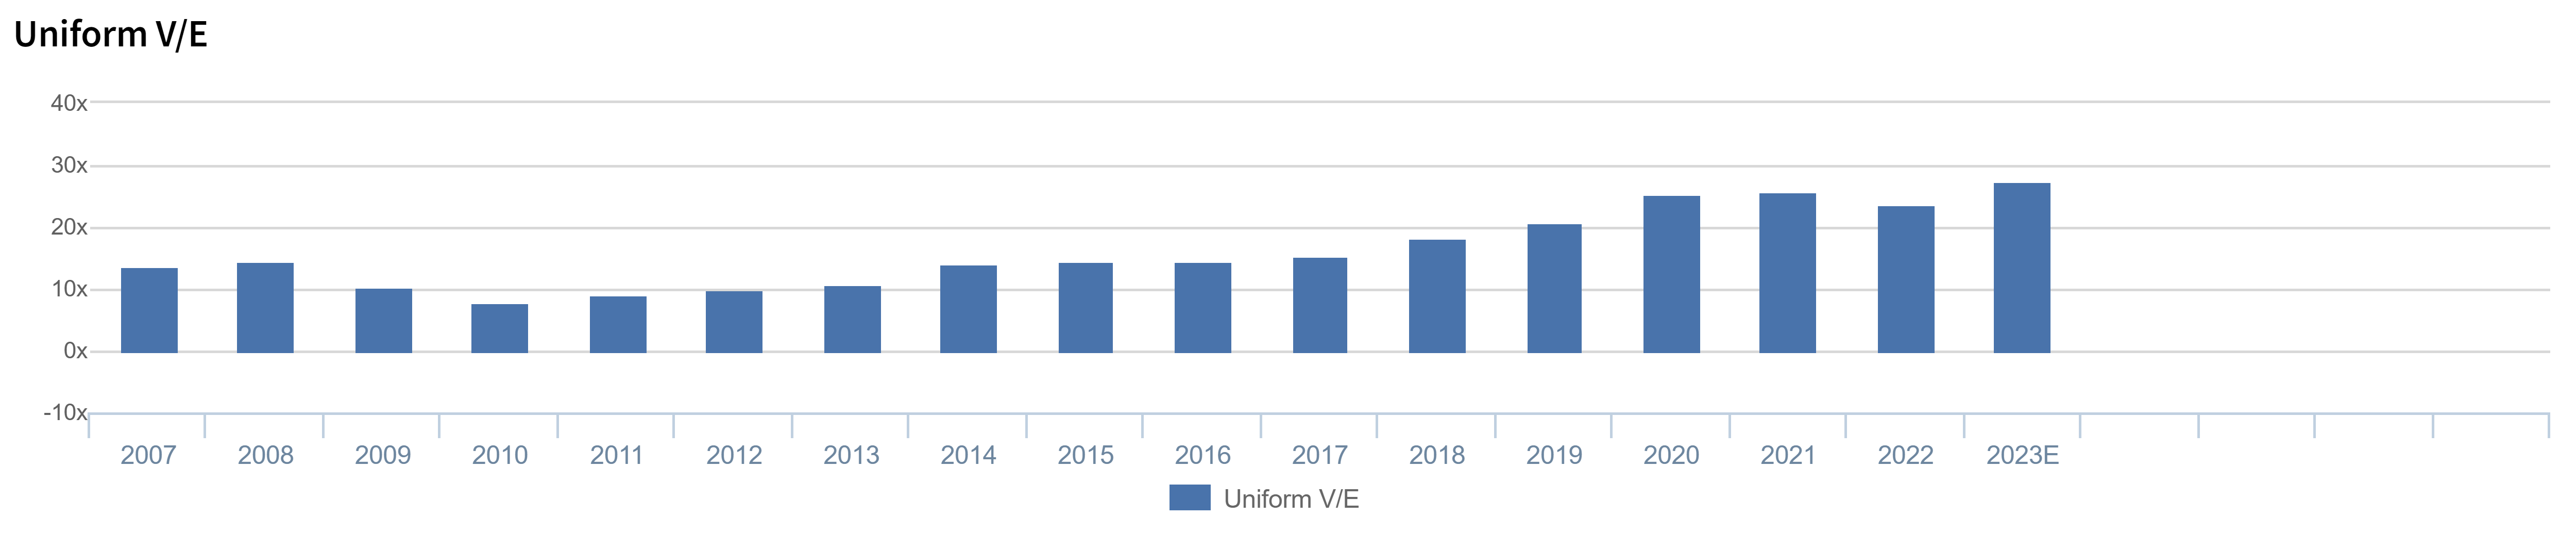
Uniform V/E is a cleaned up, forward-looking Value-to-Earnings metric. The numerator is the Uniform Enterprise Value of the firm, and therefore the same “V” from the Uniform V/A metric. The denominator which is the adjusted earnings number is the same calculation as in the numerator of the one year forward Uniform ROA calculation.
Over the duration of an economic cycle, Uniform V/E tends to be between 15x to 20x, based on the market’s expected sustainability of the cash flows the company is expected to generate. Start-up firms in early stages of growth can show extremely high and even negative Uniform V/E multiples. Companies with extremely “bad years” of performance can also show such negative Uniform V/E valuations as the market “sees” through the near-term problems and attempts to value the firm based on longer-term future cash flow streams. In both of these cases, the value of deconstructing the Uniform V/E into Uniform V/A and Uniform ROA can be far more useful.
Uniform V/E is very similar to a traditional V/E in its use. Uniform V/E is useful on an absolute basis; low Uniform V/E firms have low expectations of future performance by the market. High Uniform V/E firms have high expectations of future performance in terms of growth and returns. One should be careful not to judge high Uniform V/E firms as immediately “overvalued” or low Uniform V/E firms as undervalued. The measure merely reflects the forecasted future cash flows of the firm relative to the one year forward performance expected.
The Uniform V/E can be useful as a relative valuation tool, comparing it against a company’s peers in its sub-industry, industry, sector, and relative to its historical valuations. If a company is trading at a substantially lower Uniform V/E than it has historically, though fundamentals such as Uniform ROA and Uniform asset growth have not changed, the company may be undervalued, and visa versa.
The combination of triangulating three distinctly different valuation models on one chart can be powerful in understanding the expectations of the market form different perspectives. The market-implied Uniform ROA is based on Discounted Cash Flows. The Uniform V/A is valuable in the context of the Uniform ROAs of the firm, and the Uniform V/E can be examined like a traditional P/E would be for comparing valuation levels.
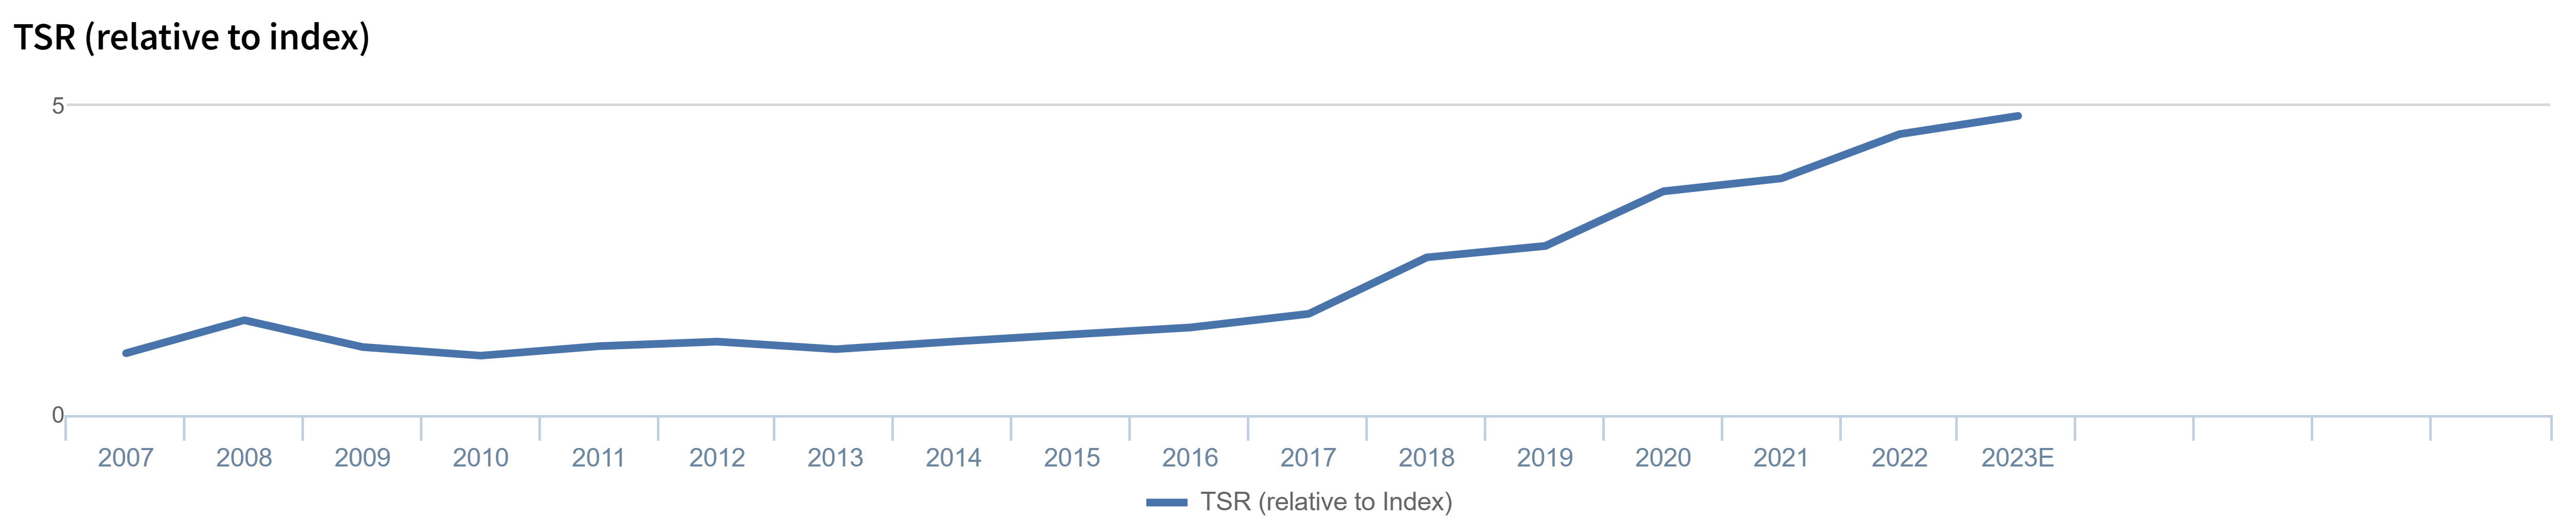
Total Shareholder Returns (TSR) Relative are traditionally known as the capital gains of the stock, adjusted for any stock splits or similar action, plus dividends, over some period of time. No adjustments are made to the well-known standard calculation.
TSRr calculates the TSR relative to the performance of the S&P 500 in the USA, or some other major market index (if it’s more relevant) when examining companies in other countries. If the stock returns 20% in capital gains and dividends in a year, and the market returns the same 20%, then the TSR Relative will show the company’s TSR as flat or horizontal in the chart for that year.
When the Relative TSR is above 1x for any given period, the line is sloping upward, and it means that the company’s TSR has outperformed the market. When the line is sloping downward for any given period on the chart, the company’s TSR has underperformed the market.
It is very possible that in years where the market shows high returns, the TSRr of the company can slope downward, and yet have still posted positive stock returns in absolute value – and vice versa. Firms that continuously “surprise” the market with Uniform ROAs and Uniform asset growth rates in excess of the market’s expectations will see the firm’s TSRr slope upward for that same duration of time. A firm where expectations were already very high for future Uniform ROAs and growth, and which succeeds in meeting that expectation, will see the TSRr slope evenly with the market. Meanwhile, a firm with very low expectations of performance, which simply surprises the market with mediocre performance levels, and yet still above prior expectations, can see TSRr slope upward precipitously.
Great companies are often not great stocks, and vice versa, depending on expectations.